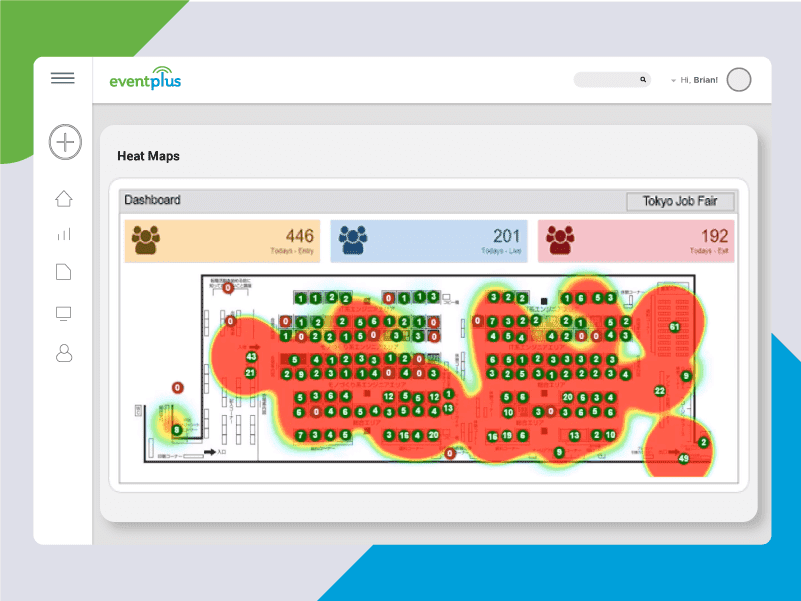
Real-time Heatmap
Eventplus’s RTLS engine will enable real-time heatmap features for physical and online events; Online event will provide a cosy feel and in physical event heatmap will help to avoid rush.
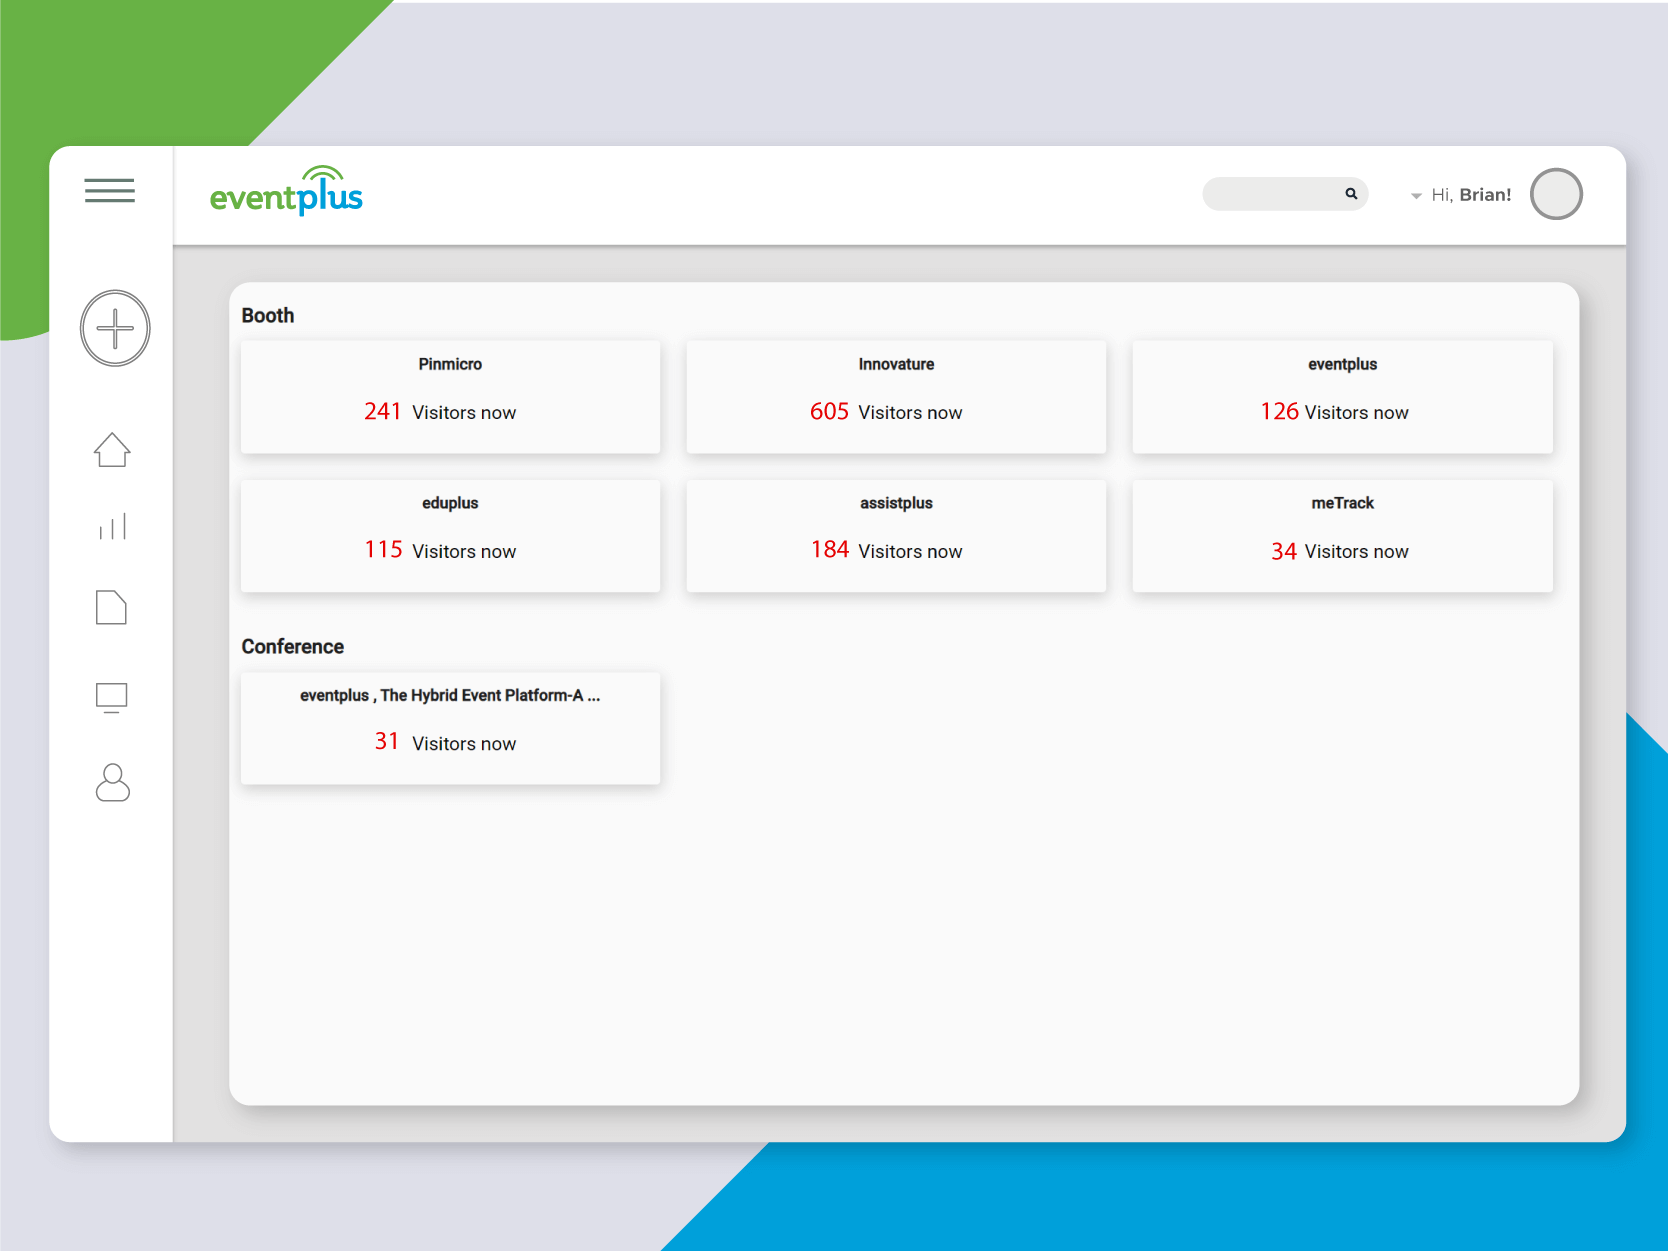
Live Dashboards
Eventplus provides live dashboards that lets the organizers the exact number of visitors in each booth and conferences in real-time
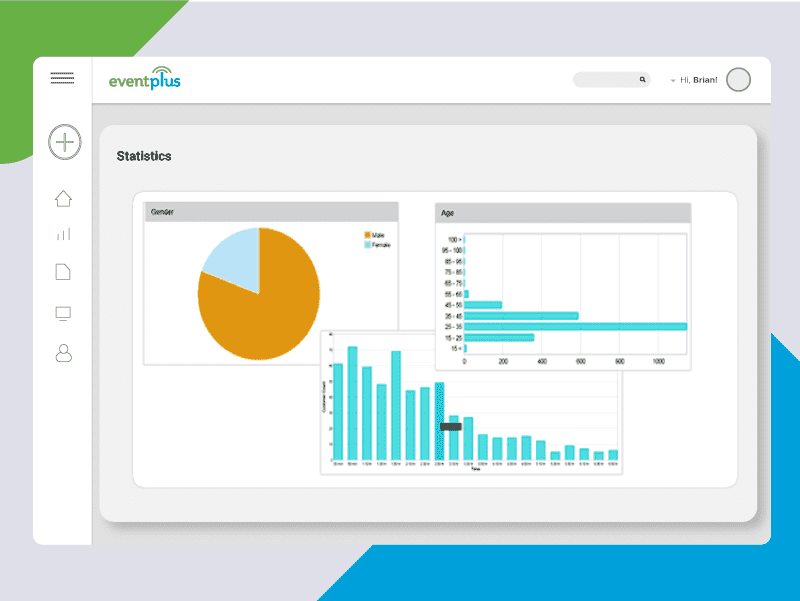
Real-time Statistics
Pinmicro’s eventplus provide a complete statistics of events such as entry / exit / spent time / hot booths etc.
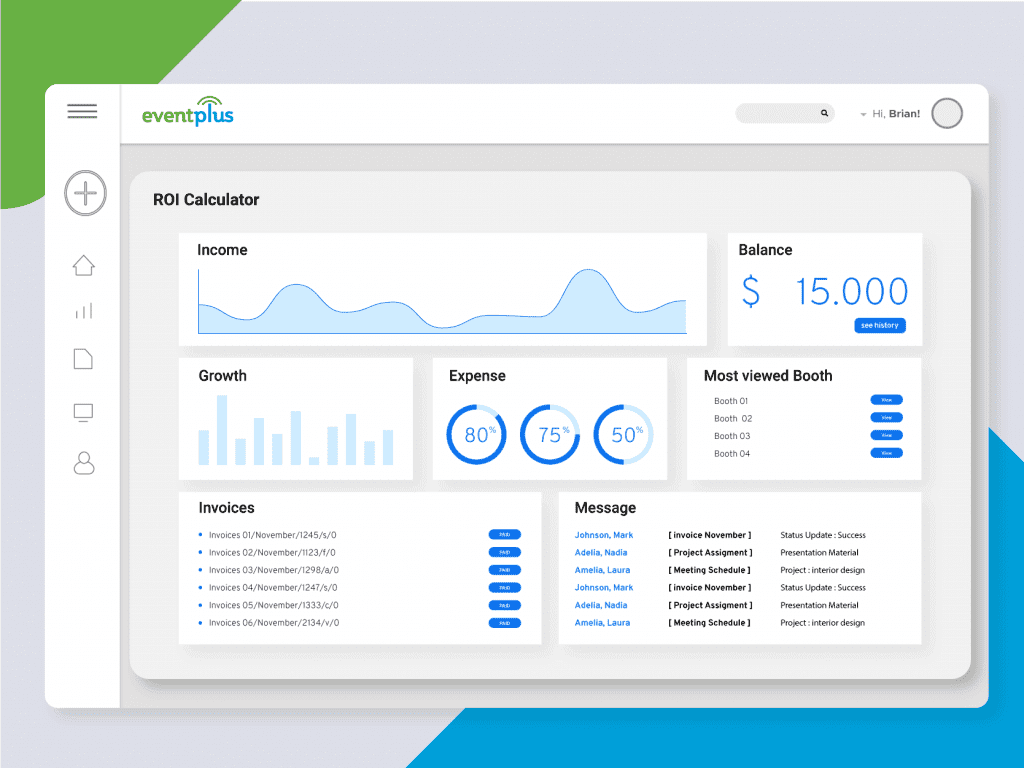
Measure ROI
How successful was your event? Evaluate the real ROI of your events and obtain qualified leads for upcoming events.

Booth & Product Performance
Crystal clear view of booth performance to exhibitors and organizers.